FRACP Madness: Cardiac Catheterisation in Valvular Heart Diseases
 OK... I am going nuts from studies, so I thought I would have some fun making cartoons to aid in my understanding, as well as simplifying things for my study group members... Please feel free to correct... (Chong Seng, if you are reading this, you should know these graphs inside out, you crit care nuts!)
The rules to understanding these graphs are that you only consider two pressures at a time, one in the structure BEFORE that valve, and two in the structure AFTER that valve.
1st graph is mitral stenosis, so we will only consider LV pressures and LA pressures. Black line LV is left ventricular pressures during catheterisation, and LA equals left atrial pressures.
The peaks of black line equals ventricular end systolic pressures (which equates to about 120mmHg) and the troughs are ventricular end diastolic pressures. As you can see, atrial systole (or the a wave) happens during ventricular diastole and and the v wave coincides with ventricular systole (due to back pressure on atrium during the closure of AV valve)...
Features of mitral stenosis are:
1) There is prominent a waves on L atrial pressures (due to forceful LA contraction against a stenosed valve)
2) There is LA - LV pressure gradient during diastole (as indicated by shaded area)
The waveforms are going to be exactly the same on doppler echo (FRACP Part B 2001 Q 17)
Increased LA pressures mean that you get pulmonary venous congestion every now and then (especially on exertion). In time, this leads to pulmonary hypertension, RV failure and sequalae...
 2nd graph shows mitral regurg. Features include:
1) "a" wave profile is normal (due to passive flow during ventricular diastole)
2) "v" waves are more prominent and peaked (due to regurgitant jet into the LA)
Chronic MR also causes pulmonary congestion and similar consequences to right ventricle.
Functional tricuspid regurg (due to pulmonary hypertension) has similar characteristic wave forms that one should be able to detect in JVP.
 This is aortic stenosis. When it comes to aortic valve, we only consider LV pressures (black line) and aortic pressures (red line).
Generally, LV end systolic pressure should equal aortic systolic pressure (ie, at 120mmHg). Aortic diastolic pressure is usually higher than LV end diastolic pressure due to recoil pressure from systemic vascular resistance onto closed aortic valve. (That's how you get peripheral blood pressure of 120/80).
So features of aortic stenosis include:
1) Pressure difference between aortic peak systolic pressure, and LV systolic pressure (as indicated by delta P)
2) Diastolic pressure profiles remain unaffected
And remember, that is how you get slow rising pulse in aortic stenosis and also narrowed pulse pressure. (Pulse pressure = Ao systolic - Ao diastolic)
 Graph 4 shows aortic regurg.
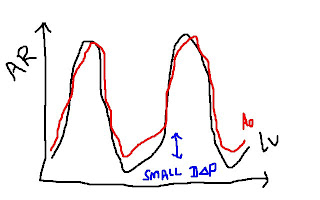
There should be no difference at all in systolic pressures (assuming there is no obstruction to forward flow). However, because there is no barrier during ventricular diastole due to leaky aortic valve, a proportion of blood that is ejected forward will fall back into LV without any resistance. Therefore, aortic diastolic pressure drops significantly and in severe cases, will come close to LV diastolic pressures.
Features include:
1) narrow diastolic pressure gradient between aorta and LV
Clinically, one will detect rapidly collapsing pulse as well as widened pulse pressure...
I hope that makes more sense now...
Remember that all these wave forms can be substituted into doppler waveforms so there is not much difference...


0 Comments:
Post a Comment
<< Home